Most Recent Tsunami of Interest
Many areas of the Pacific can generate tsunamis that affect the North Coast. Here is a summary of the most recent tsunami to trigger a tsunami alert in California.
January 15, 2022 - Hunga Tonga-Hunga Ha’apai Eruption
Summary
The Hunga Tonga - Hunga Ha’apai volcano erupted on January 15, 2022, and produced the strongest atmospheric blast ever recorded on modern instruments. It also generated a tsunami that affected the entire Pacific Ocean, and was recorded in parts of the Atlantic Ocean and Mediterranean Sea. Five deaths were reported from the tsunami - 3 in Tonga, 2 in Peru. There were 18 injuries, including 14 in Tonga, 1 in Japan and 3 in California. There was no reported damage or injuries on the North Coast. The tsunami was recorded by the tide gauge in Crescent City for six days. It was also observed in other harbors and ports along Del Norte, Humboldt and Mendocino County coastlines. In Santa Cruz, California there was some flooding into the parking lots as well as strong currents in the harbor that moved several vessels and caused some damage. Several people were caught off guard by the tsunami near San Francisco and required assistance from the US Coast Guard and Fire Departments.
Unless otherwise noted, all times here are in Pacific Standard Time (PST). PST is 8 hours behind UTC and 21 hours behind the local time in Tonga.
Volcanic Eruption & Explosion
The Tonga Islands are a volcanic archipelago in the Southwestern Pacific that make up the nation of Tonga. It’s located 8,489 km (5,275 miles) away from Humboldt County.
Hunga Tonga-Hunga Ha’apai is a small volcanic island that first rose above the ocean in 2015. Located only 65 km (40 miles) from Tonga’s most populated island Tongatapu and the capital Nuku’alofa, it built a two-mile island that reached an elevation of 114 meters (374 ft) above the ocean surface before the recent eruption.


Google Earth image taken May 2016 (scale bar is one mile)
NASA scientists have been monitoring this volcano closely since 2014. This animation shows the formation and changes to the Hunga Tonga - Hunga Ha’apai volcano between 2014 and 2017.
Although the surface expression was small, the volcano edifice extended to the sea floor, 2,000 m (6,500 feet) below the ocean surface.
The most recent volcanic episode began in December 2021 with explosions that reached several thousand feet high. Activity increased on January 14, 2022 with ash clouds reaching 2 km (~66,000 ft).

Scientists with Tonga Geological Services monitor the eruption of Hunga Tonga - Hunga Ha’apai. From Tonga Geological Service Facebook https://www.facebook.com/tongageologicalservice
The eruption of January 14, 2022 produced the largest plume ever observed. Those in the region monitoring the event recorded footage from the eruption.
This explosion was caused by the violent expansion of sea water to steam as the rising magma interacted with the ocean and gasses escaping from the magma. Violent volcanic explosions also destroyed portions of the volcanic island and generated tsunamis.
The January 14th eruption was so large that it was observed from space. Satellites in the area captured the eruption column and the resulting shock wave as it moved through the atmosphere. The explosion was heard by people in Fiji, Tonga and the surrounding region.
The explosion was also heard as far away as Alaska by residents and it was recorded by the infrasound devices of the Alaska Volcano Observatory.

For more information about the Hunga Tonga - Hunga Ha’apai eruption, check out these articles:
- NASA Scientists estrimate Tonga blast at 10 megatons - NPR
- Tonga eruption, tsunami more unusual that first suspected - Times-Standard
- Dramatic Changes at Hunga Tonga - Hunga Ha'apai - NASA Earth Observatory
- 'Our ears were ringing' - The Washington Post
- Communication restored in Tonga 5 days after volcanic eruption - PBS News Hour
The Tsunami
A tsunami travel time map provides you with the arrival time of the first tsunami surge throughout a region. It is well known how tsunamis travel in deep water so we can model how fast the tsunami will travel in the ocean. These maps are also generated assuming the source of the tsunami is on the seafloor. Tsunami travel time maps are used to coordinate emergency response efforts.
These maps can be customized for many locations in the Pacific. Visit [link from Lori] to create a tsunami travel time map.
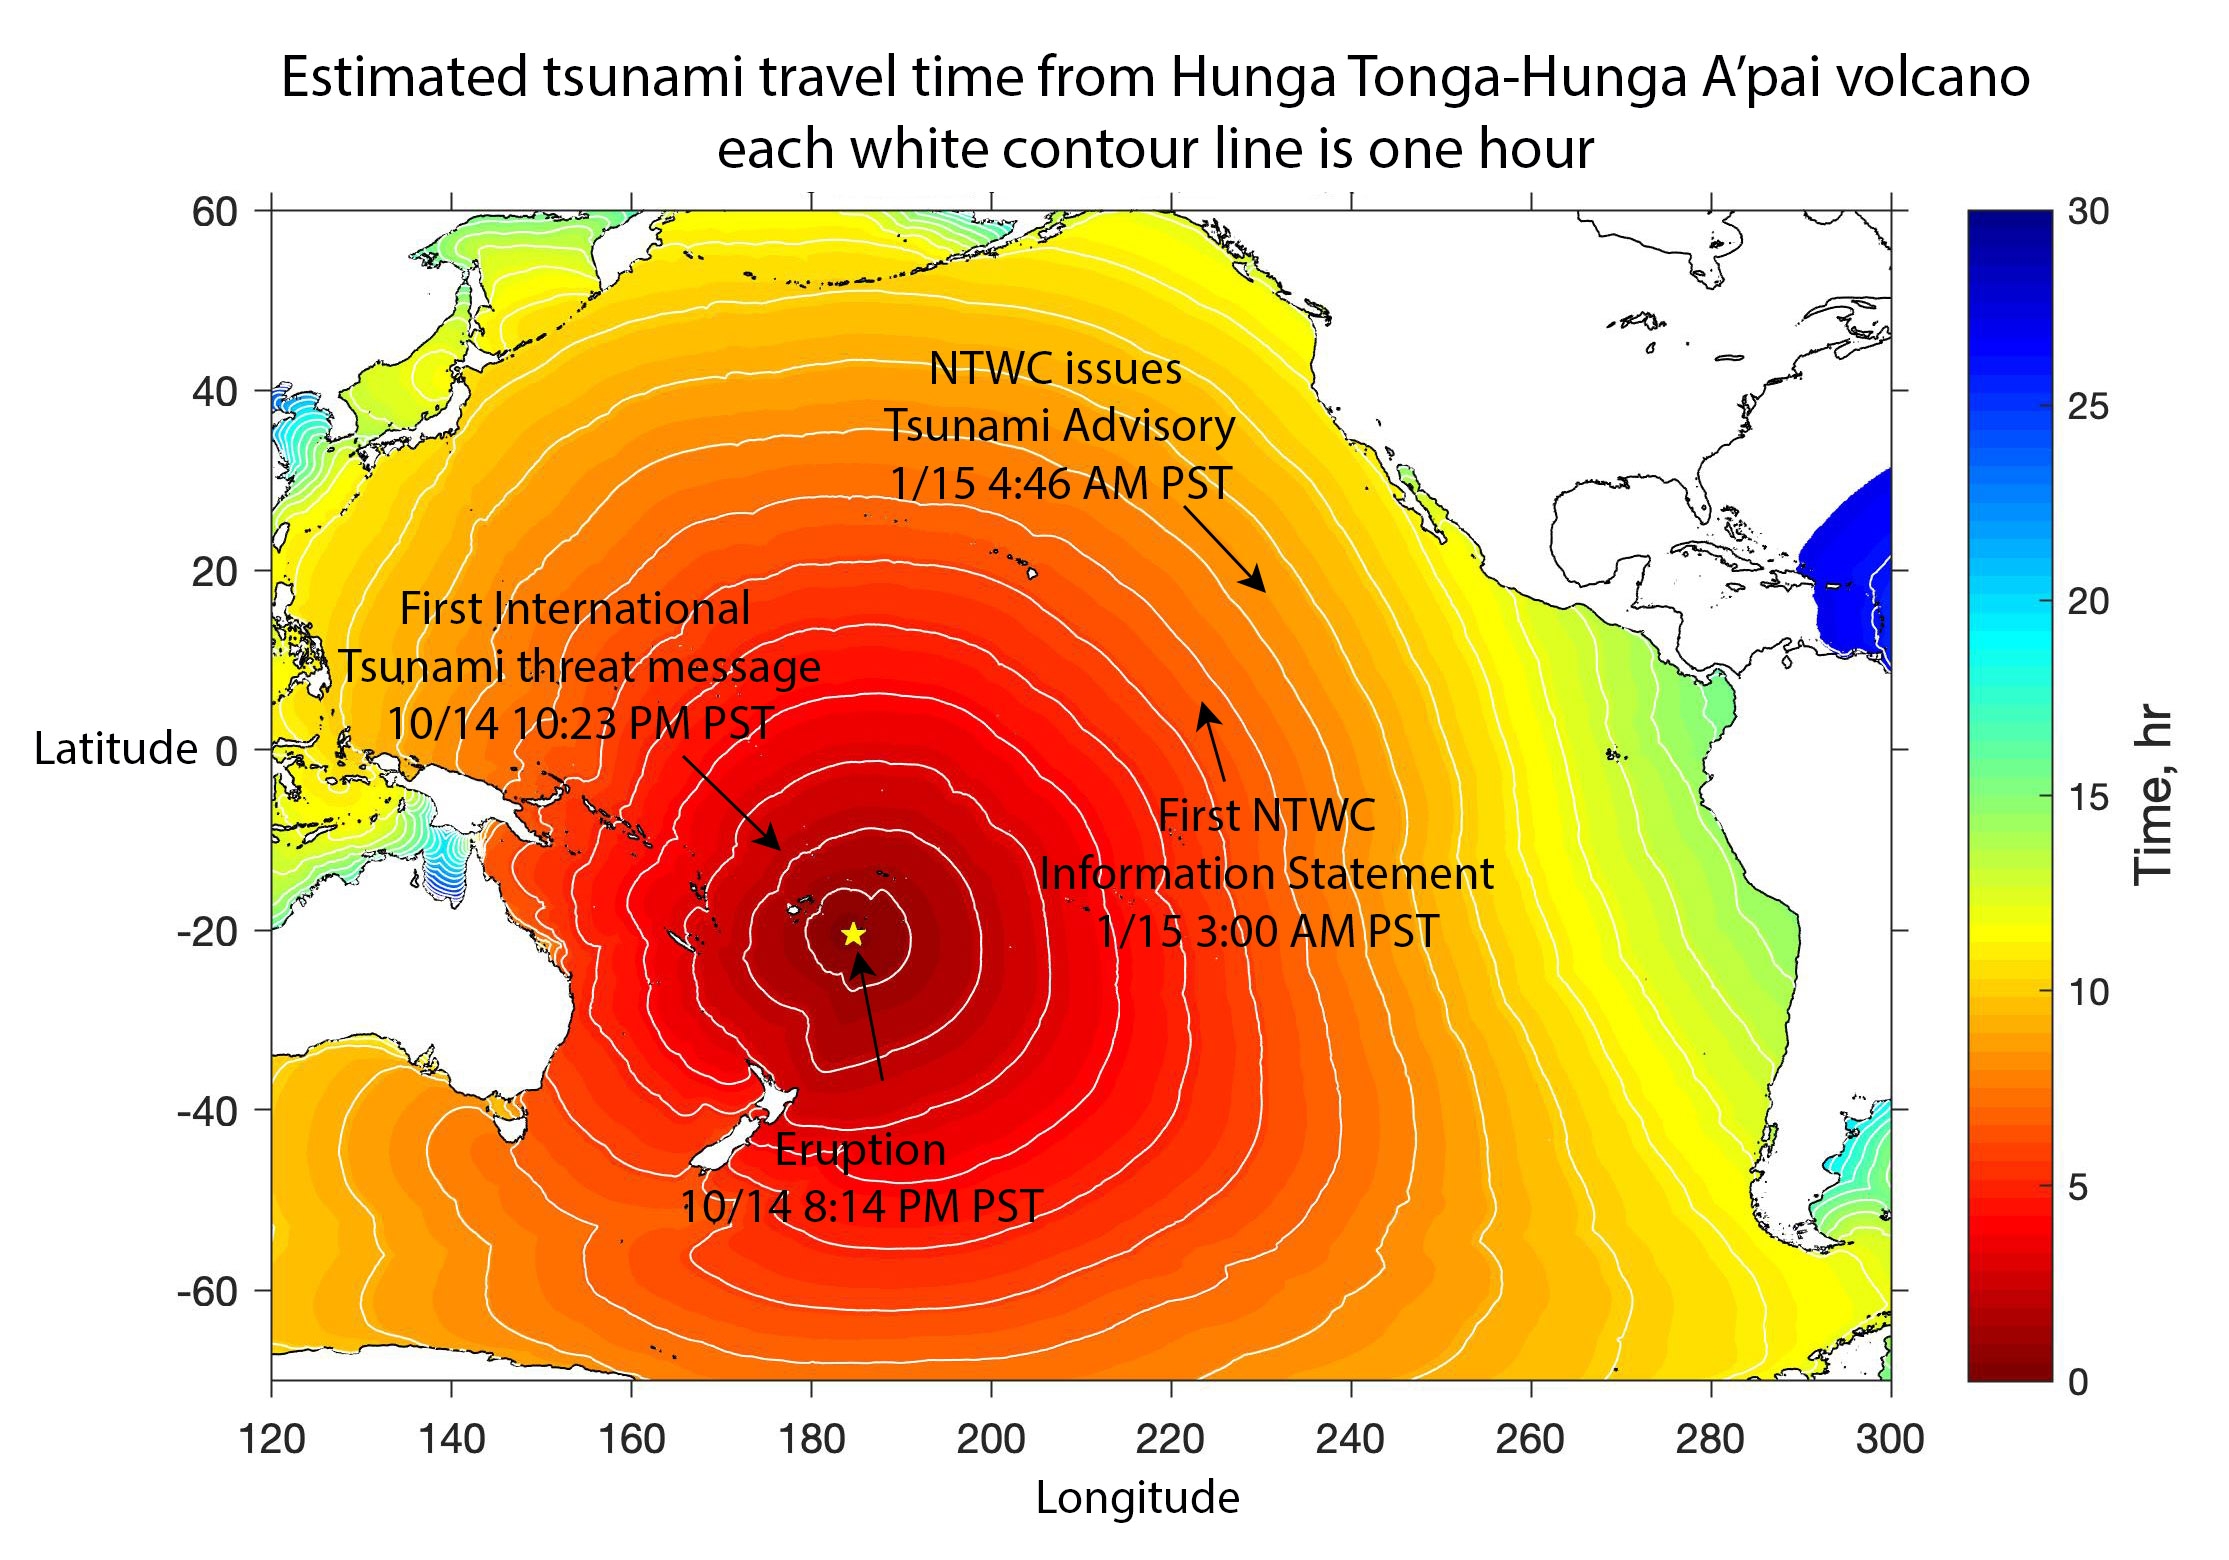
The yellow star on the map indicates the eruption in Tonga at 8:14 pm PST on January 14th. As you move away from the eruption location, each white contour line indicates one hour. The regions closest to the eruption were impacted by the tsunami first. Two hours later, at 10:23 pm PST, the first International Tsunami Threat Message was issued.
At 3:00 am PST on January 15th, the National Tsunami Warning Center issued an information statement providing details about the eruption and tsunami. At this time, the tsunami was already arriving along Hawaii’s coastline. At 4:46 am a Tsunami Advisory was issued for the west coast of North America. The tsunami was expected to arrive on California’s coastline between 7:30 and 8:00 am PST. However, the tsunami arrived earlier than expected on the North Coast as well as many other locations.

What’s the difference between a Tsunami Advisory and Tsunami Warning?
- A Tsunami Advisory is the second level of tsunami alerting. This is issued when there is expected to be strong currents in harbors and bays, and flooding is unlikely.
- The highest level of tsunami alerting is a Tsunami Warning. This is issued when there is a high likelihood of a tsunami large enough to flood areas above normal high tide.
There were no Tsunami Warnings issued for the January 15th tsunami in California.
Videos were captured and shared online during the beginning of the tsunami as those in the path were impacted. However, as the events continued, there was a delay in information coming out of Tonga due to a compromised fiber optic cable that delivered communication methods to the islands.
You can hear the eruption and see the footage of the tsunami arriving in Tonga as people are seeking safety at high ground.
The Tsunami on the North Coast
As the tsunami moved across the Pacific Ocean, it was first observed in southern California on Saturday January 15th and then continued to be observed and captured across tide gauges as it moved north.
The tsunami arrived on our coastline during high tide. This gave it a boost in height and potential for overland flow. This resulted in King Tide-like flooding conditions across coastal communities.
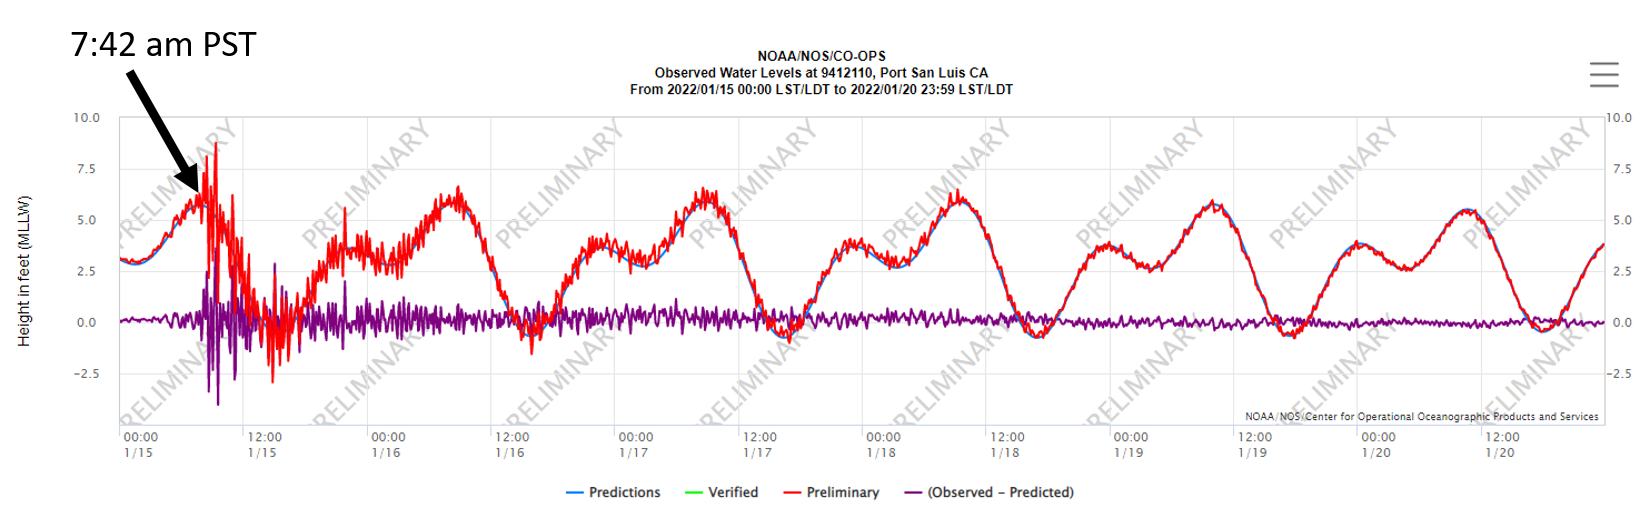
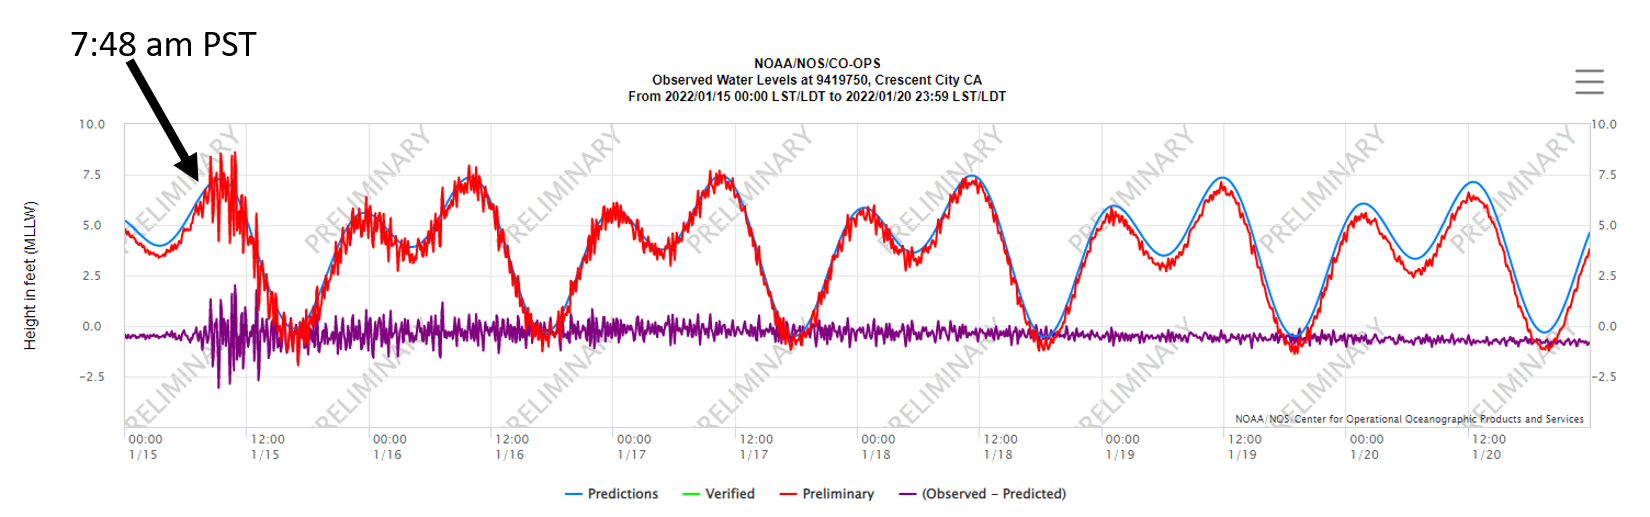
The highest water levels were recorded at Port San Luis near Pismo Beach, California. The tsunami height was just over 4 feet at this location. Crescent City and Point Arena were tied with the second highest water levels at 3.7 feet.
As the tsunami approached the north coast, it was measured by the coastal tide gauges as well as the Deep-Ocean Assessment and Reporting of Tsunamis (DART) buoys positioned offshore. The tsunami height was smaller and traveled faster in the deeper water, and as it approached the coast it slowed down and built in height.

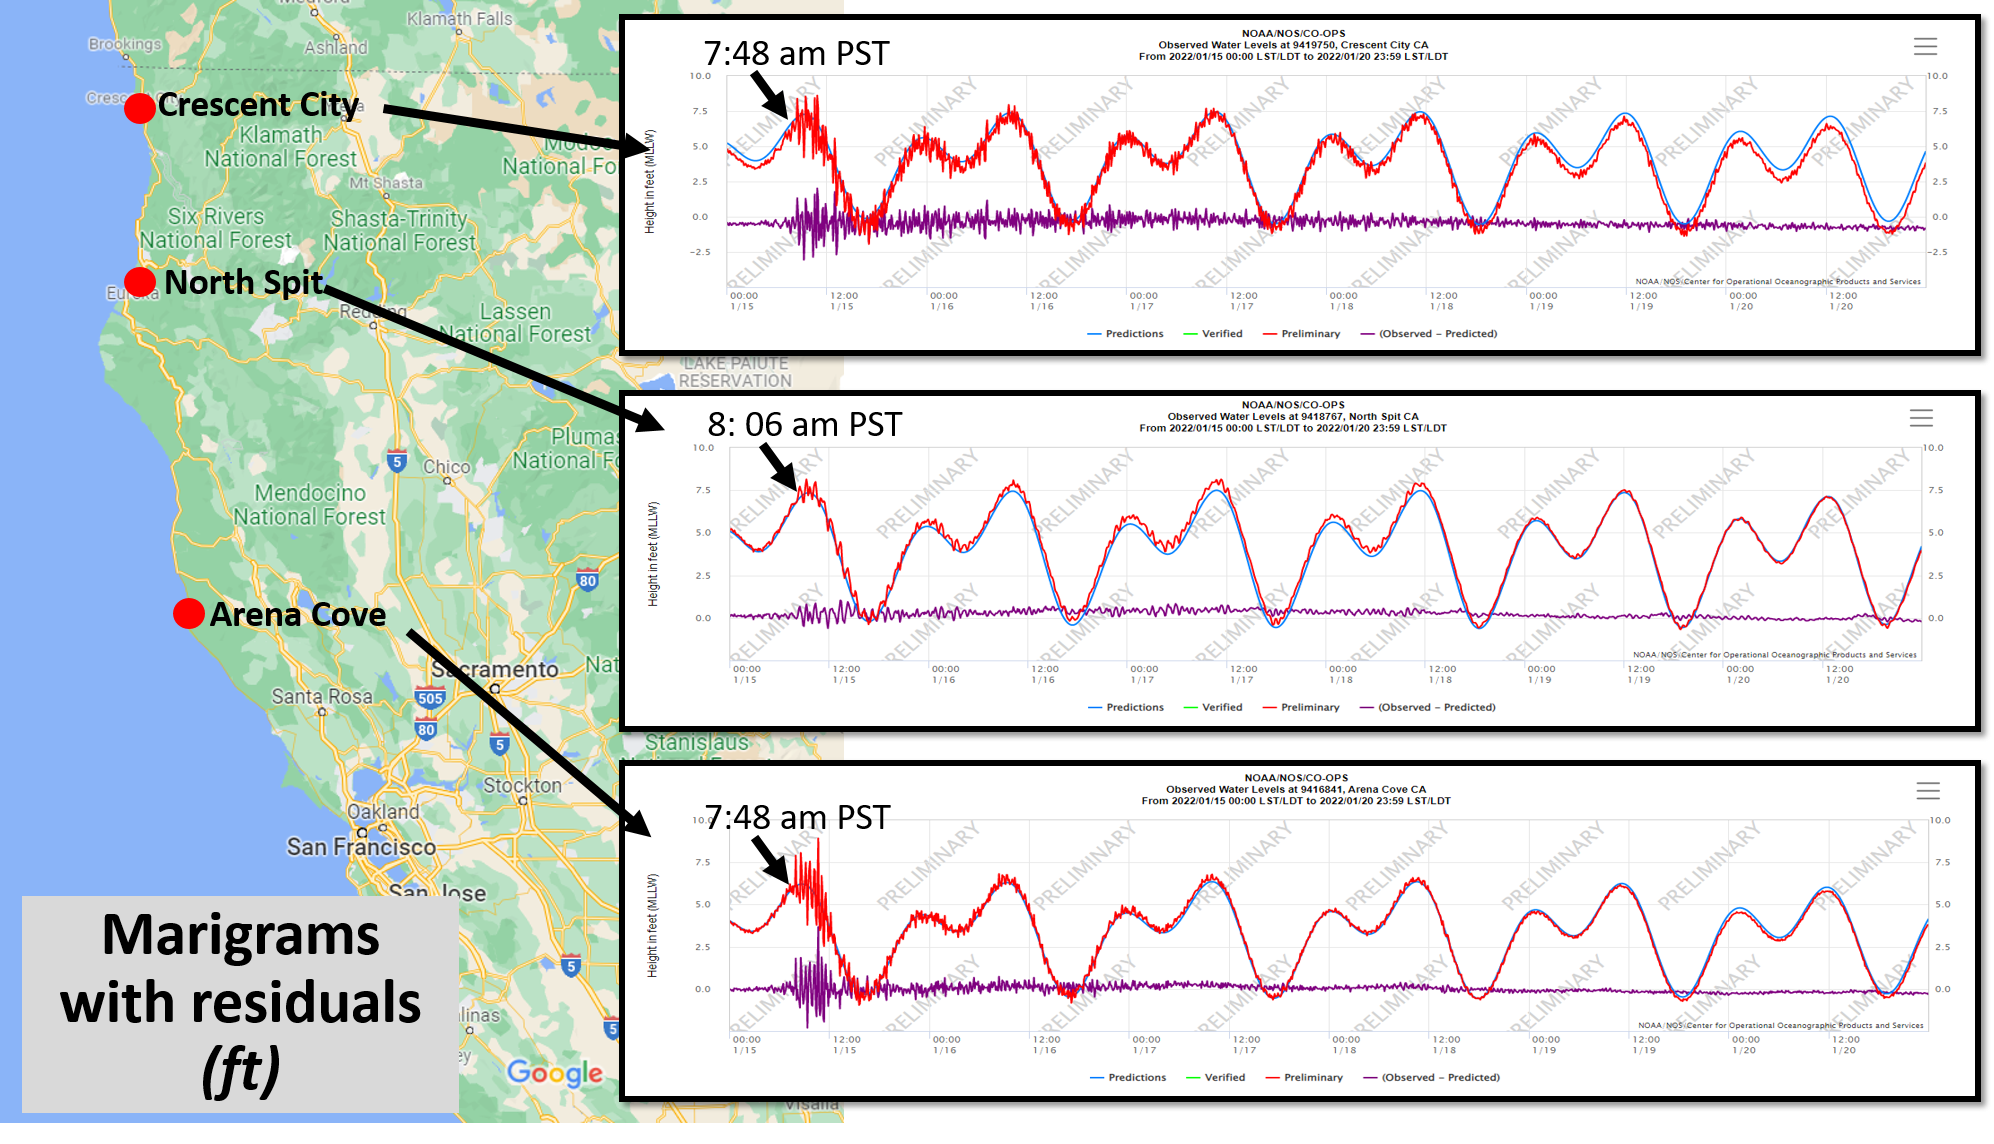
There are three tide gauges located on California’s north coast: Arena Cove gauge located in Point Arena, Mendocino County; North Spit gauge located in Humboldt Bay; Crescent City gauge located in Crescent City, Del Norte County.
The water level data collected by the tide gauge is plotted on a marigram to show the water level over time. The red line represents the actual water height recorded by the tide gauge, the blue is the predicted tidal variation for that location, and the purple is called the residual which shows the actual signal minus the tide prediction. Using this residual, we can see the influence of the tsunami itself. Keep in mind, these tsunamis ride on top of the tide and the tide stage will influence the hazards associated with a tsunami event.
We can compare the observations in Port San Luis with those from Crescent City. The graph below was captured in Crescent City and shows that the tsunami remained for more than five days. While it had the second highest tsunami heights, Crescent City recorded the longest tsunami duration from this event.
These tsunami surges were captured by many along the California coastline. The videos below show the impact of the tsunami and the dangerous hazards associated with these events.
Comparing the Japan 2011 tsunami and the Tonga 2022 tsunami
The biggest difference between the Japan 2011 tsunami and the Tonga 2022 tsunami is the size. The Japan tsunami was huge – producing a 30+foot high tsunami along 300 miles of coastline in Japan. By the time it got to California it was much smaller; however, it was still three times larger than what we experienced on January 15, 2022. A larger tsunami amplitude means much stronger currents, and in 2011 it was the currents that caused the damage on the North Coast. A Tsunami Warning was in place in 2011 resulting in evacuations in many areas of the North Coast; however, in 2022 a Tsunami Advisory was issued and evacuations were not necessary.
You can see this comparison in size by looking at two videos captured from the mouth of the Mad River near McKinleyville, CA. The 2011 tsunami can be seen pushing up the Mad River forcing those too close to the water to run for safety. The 2022 tsunami can also be seen moving up Mad River but the height is visibly smaller than 2011. The video captured in 2011 is a good example of why it is dangerous to get too close to the coastline during a tsunami event.
Impacts In California
We are still gathering information on the impacts of the tsunami in California, and this section will be updated when more information is available.
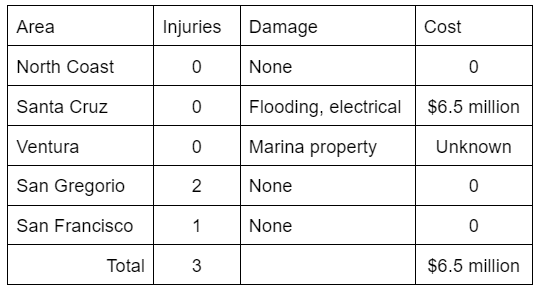
So far, there were no reports of damage on the North Coast. Throughout California, localized flooding was observed that resembled King Tide conditions which caused some complications for harbor officials and residents. Some harbors and marinas observed increased currents like Noyo River, Santa Cruz Harbor, and Ventura Harbor. In Santa Cruz Harbor damage to electrical systems and infrastructure is estimated at $6.5 million dollars.
The US Coast Guard responded to four fishermen who were swept out to sea resulting in two injuries and a woman at China Beach who needed medical care. Along with the San Francisco Fire Department, the US Coast Guard were also called to rescue three surfers who were caught off guard by the tsunami.
Impacts Around the World
We are still gathering information on the impacts of the tsunami, and this section will be updated when more information is available.
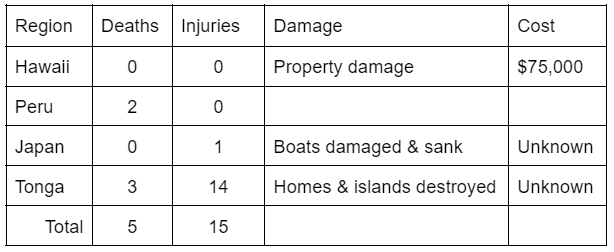
Estimates of injuries, loss, and property damage have been provided for some locations. Two deaths occurred in Peru and three in Tonga as a result of the tsunami. Property damage is extensive in the Tonga region and is still being evaluated. Property damage has also been observed in Hawaii, Japan, Fiji and Peru.
How does California respond when a tsunami happens?
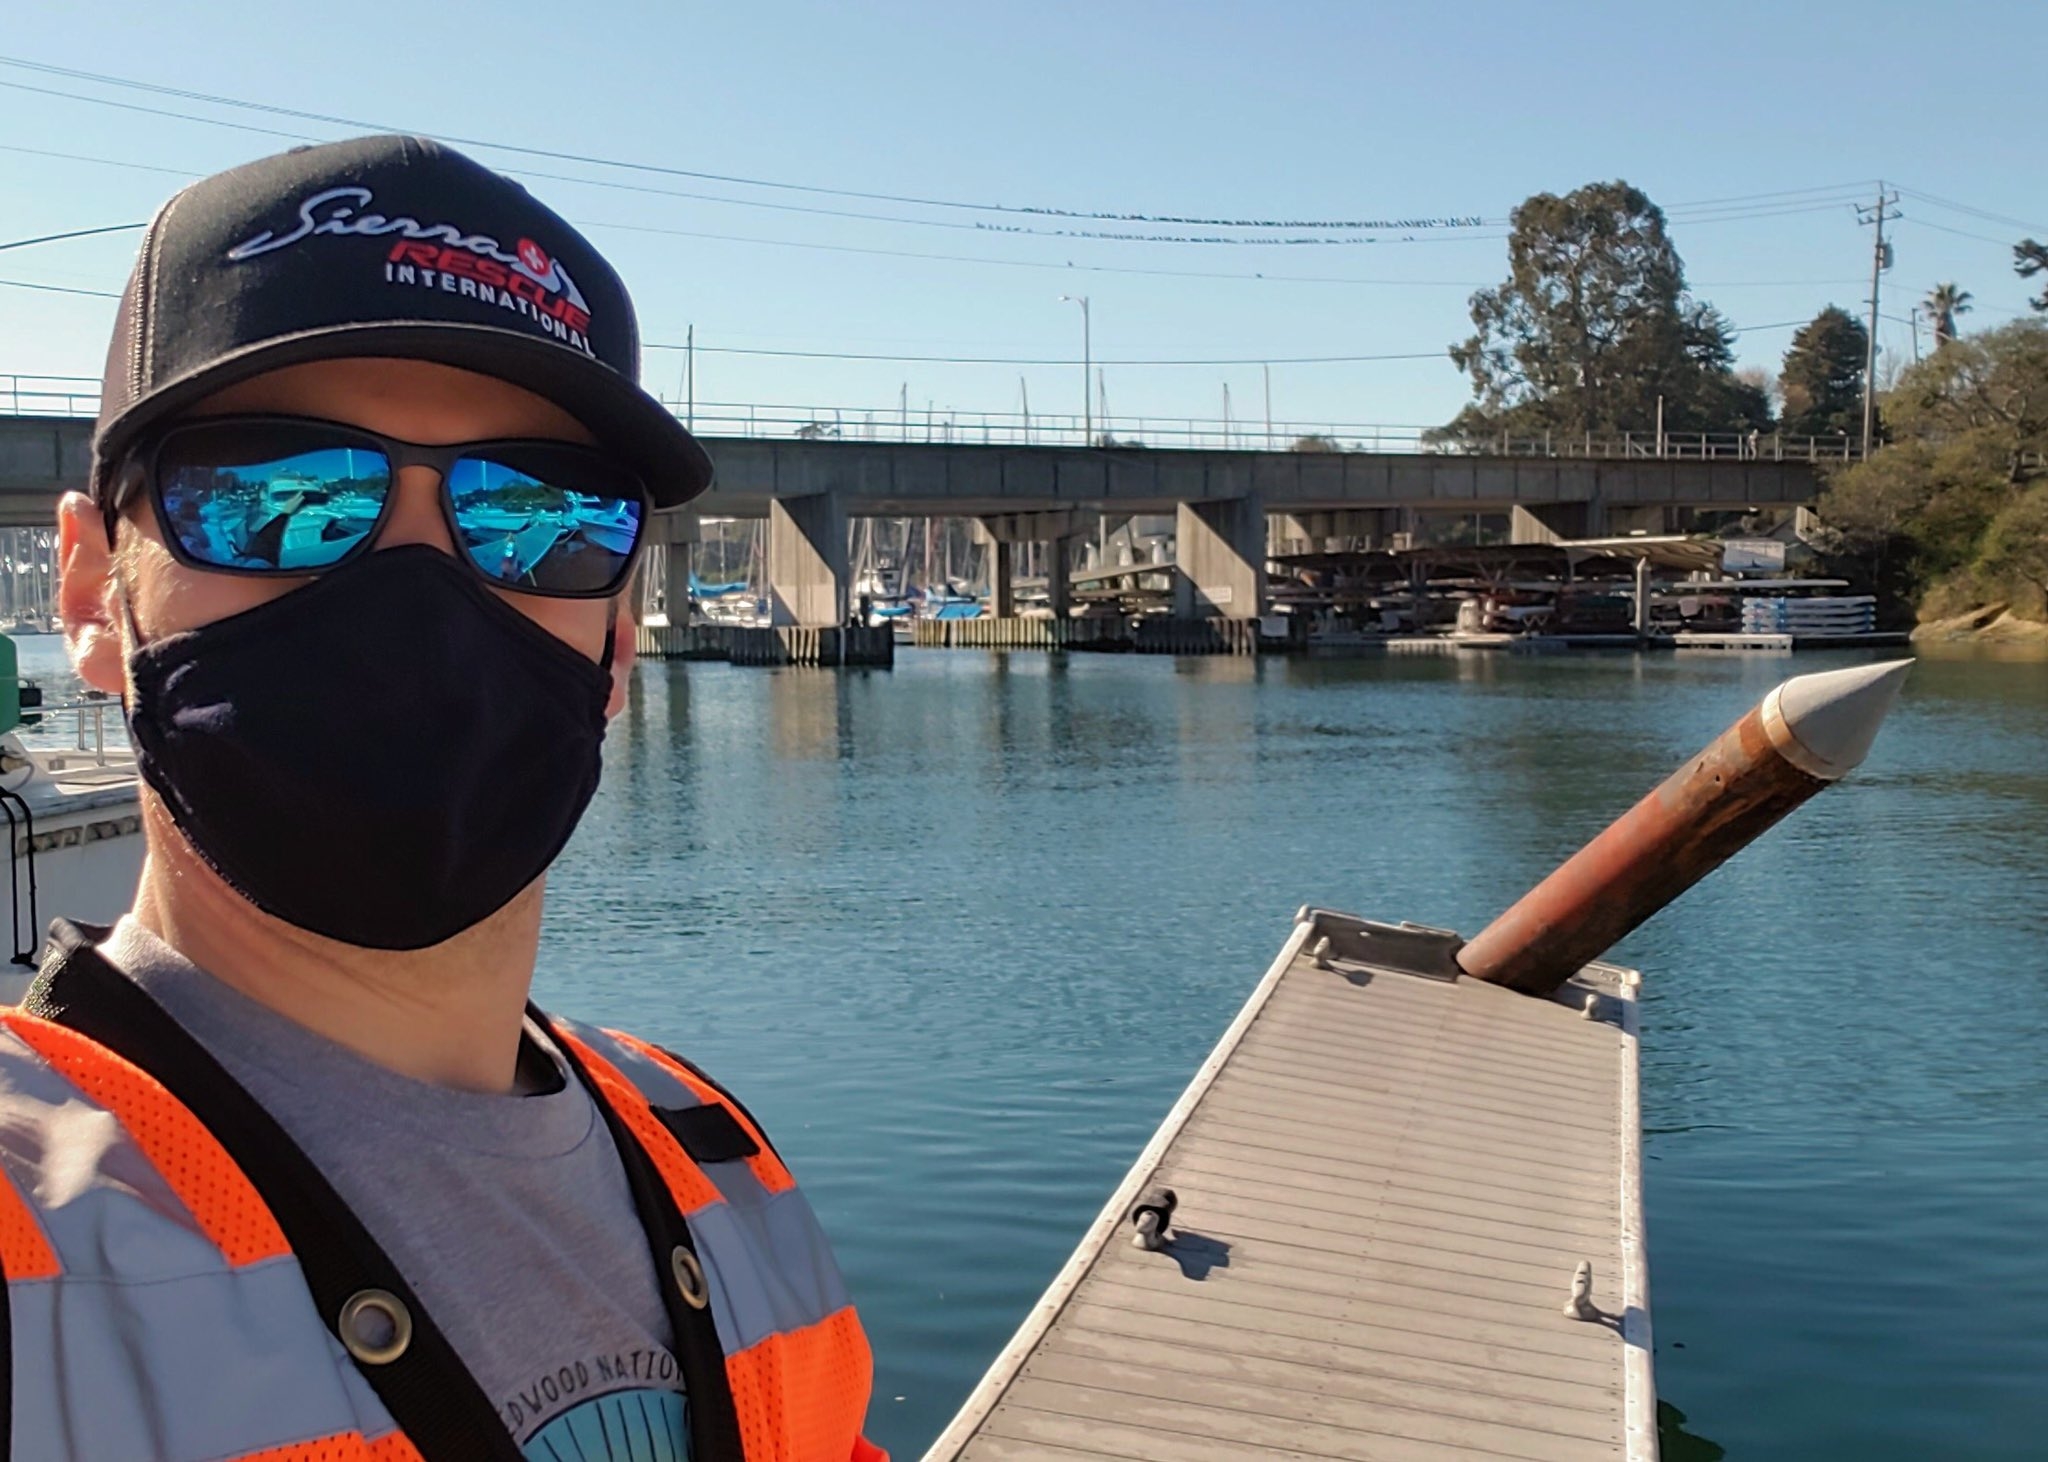
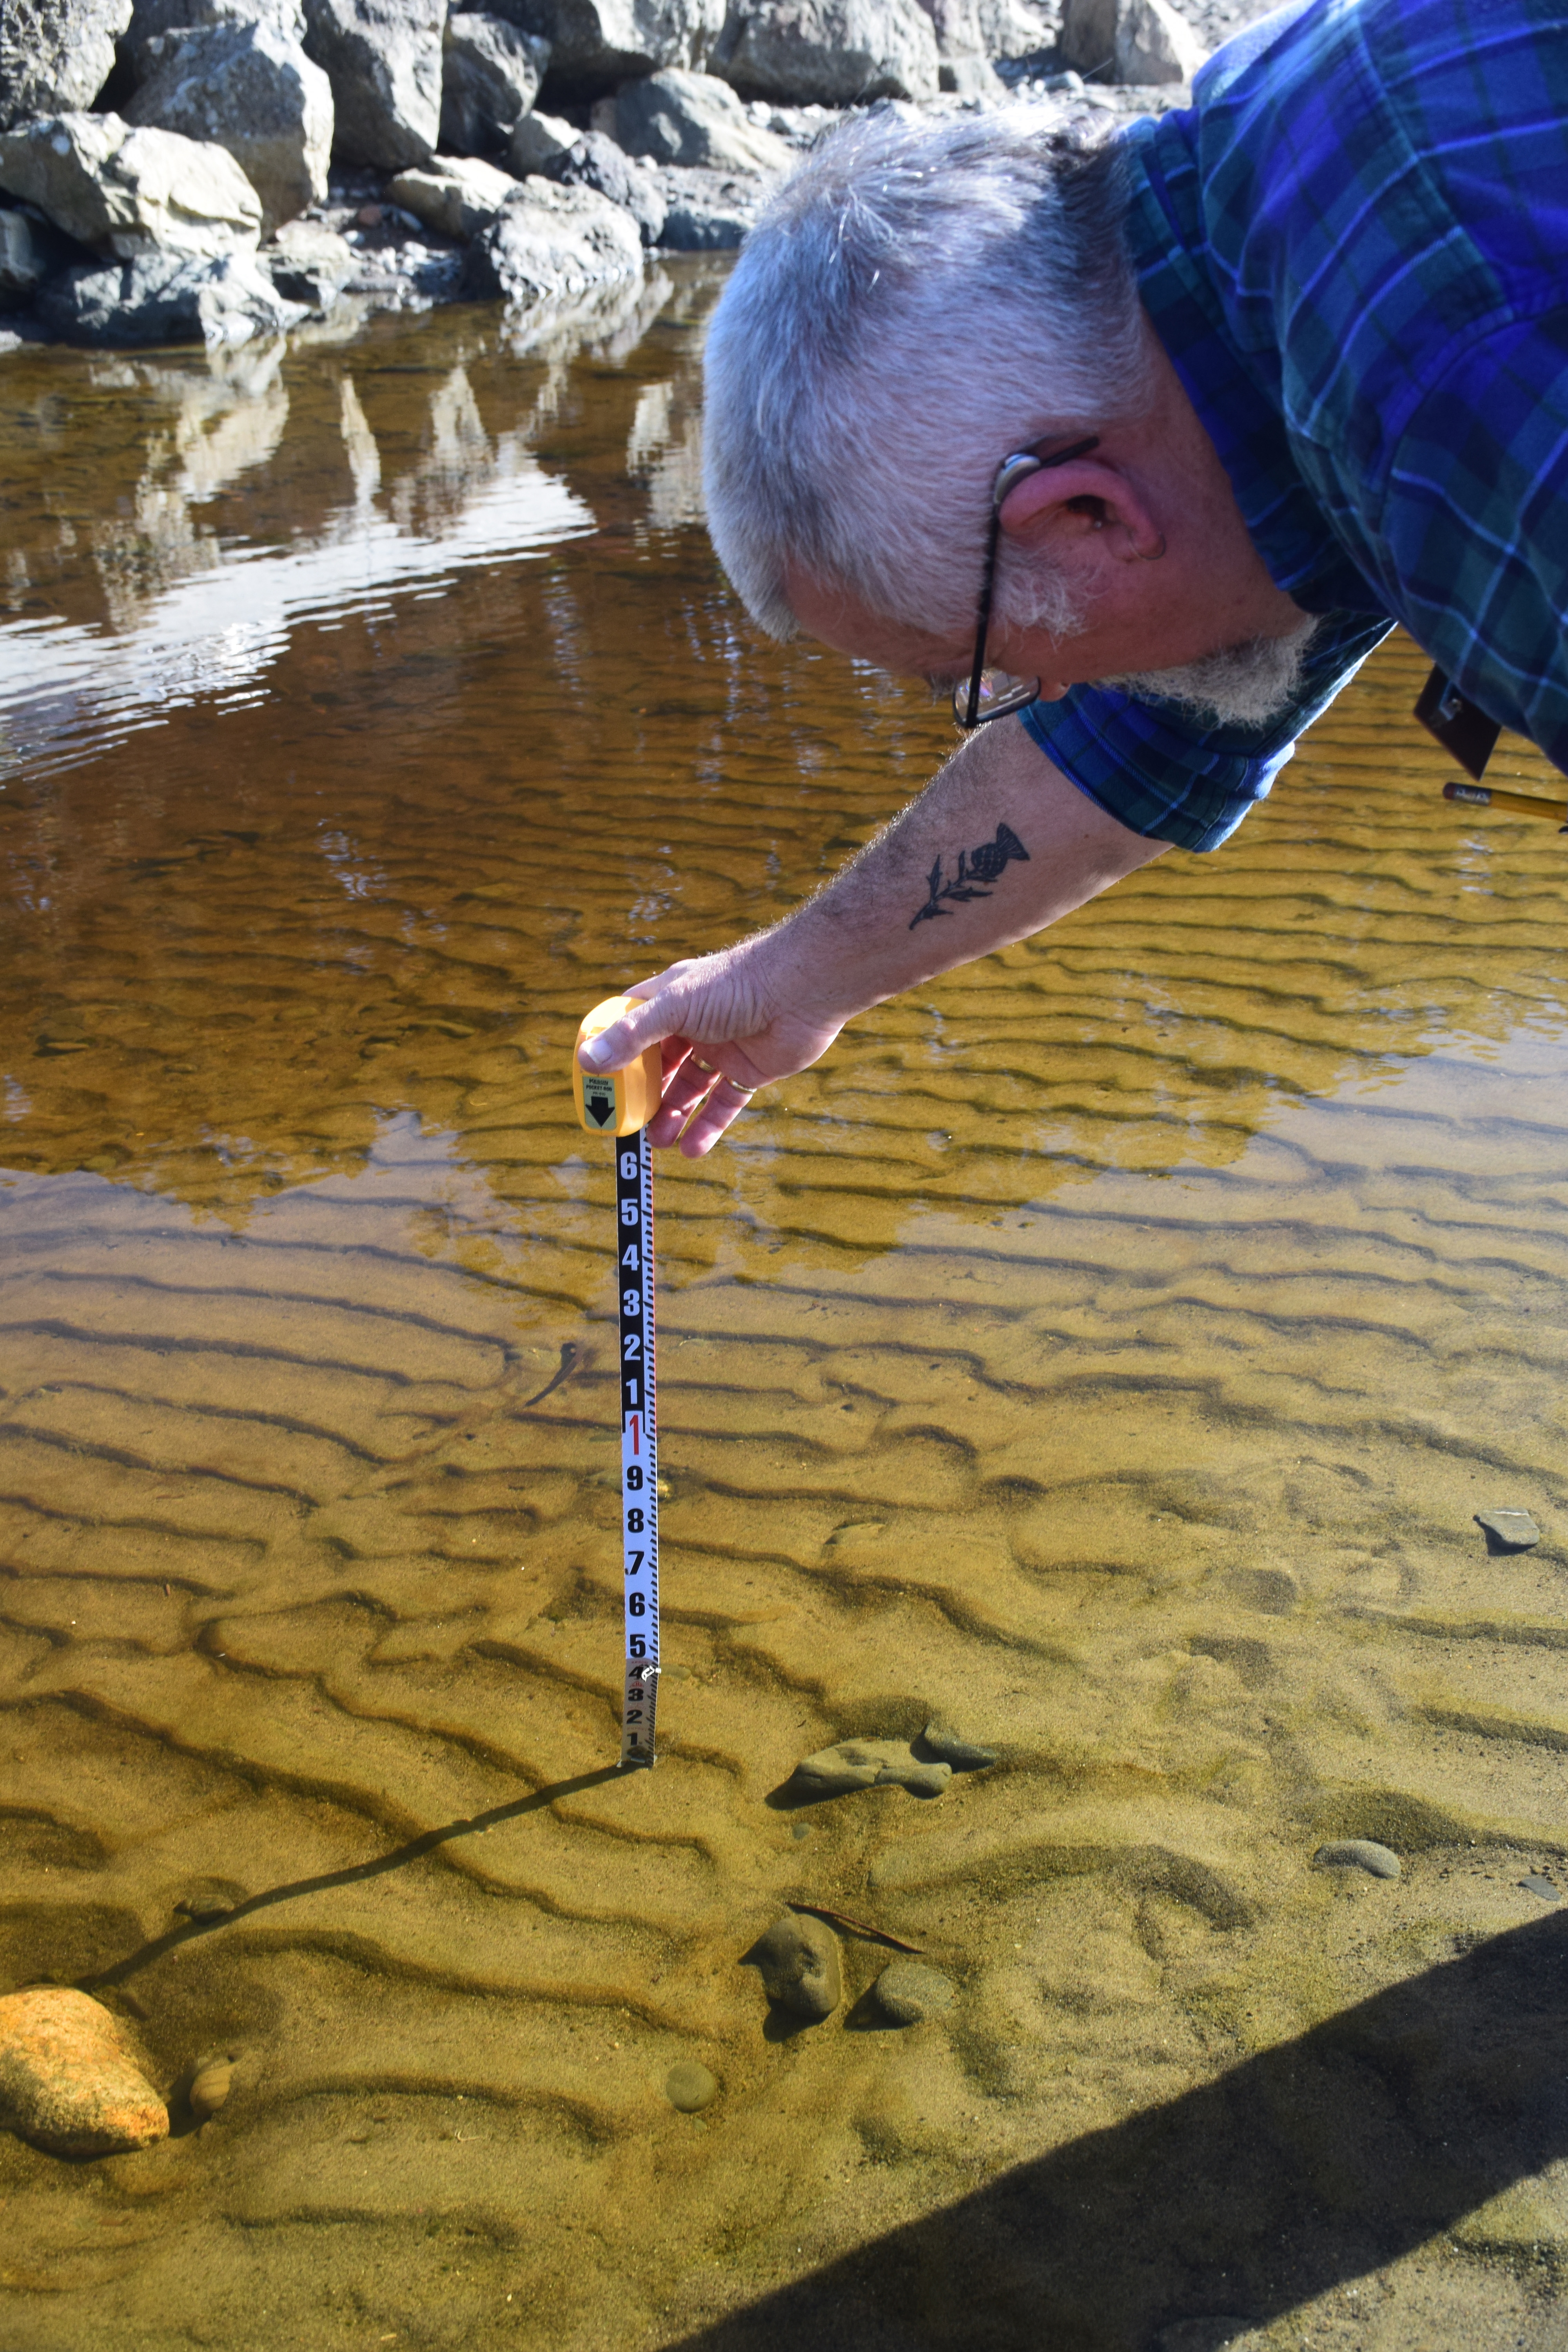
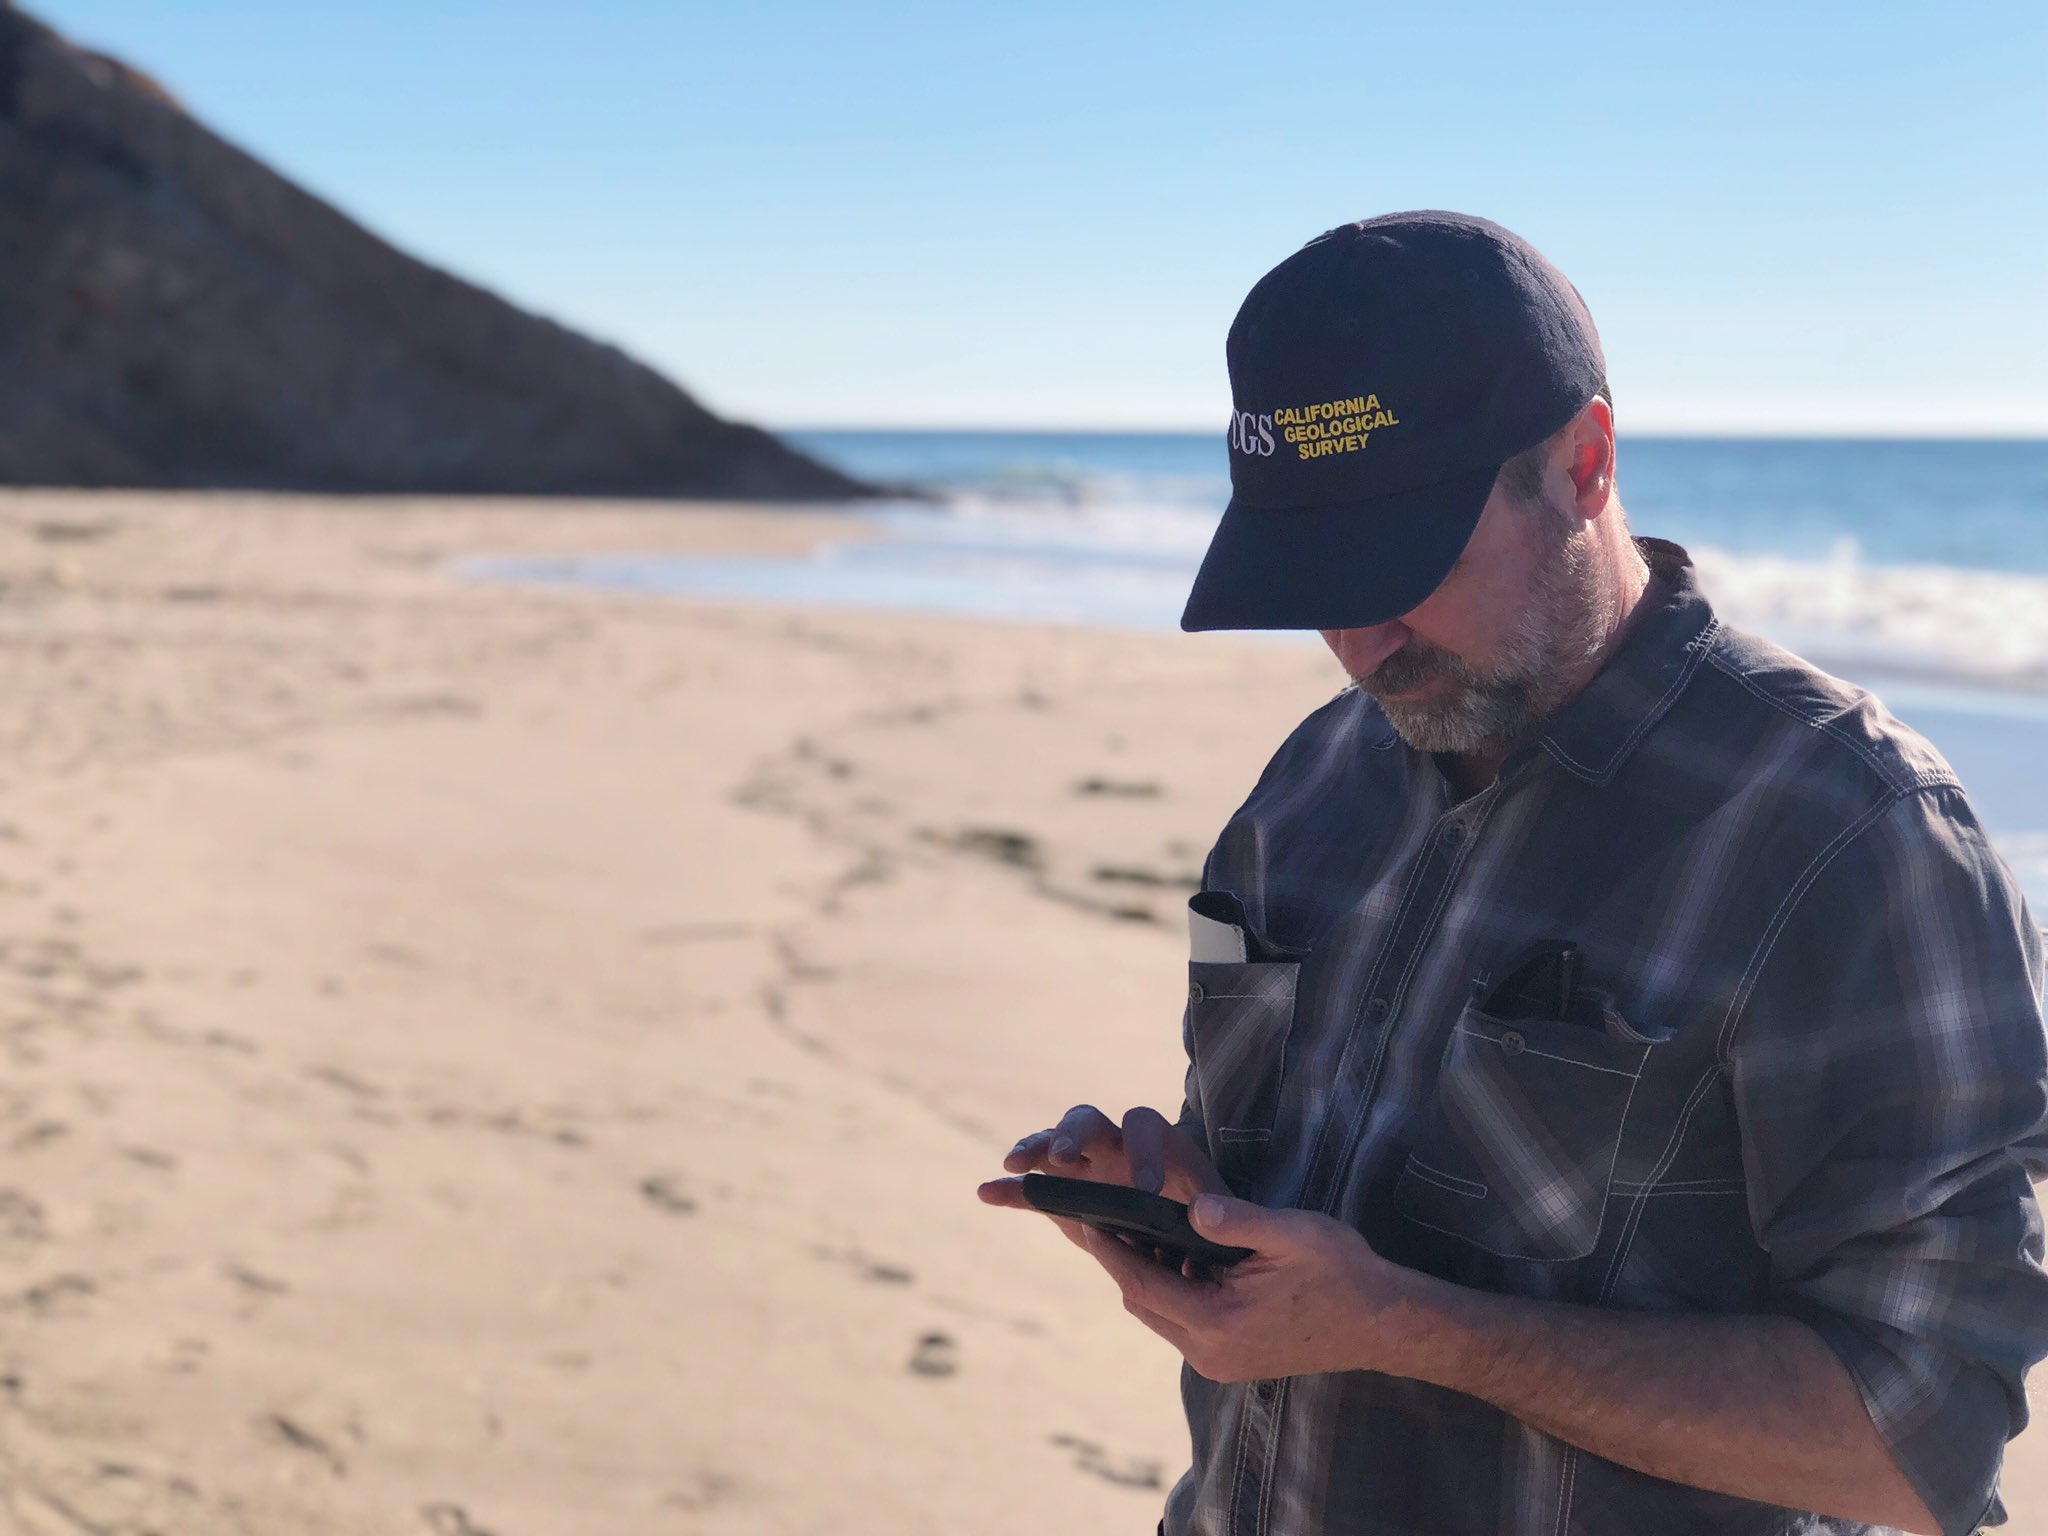
Communication and coordination are vital during these events. During a tsunami, there are conference calls set up between the state partners of California Governor’s Office of Emergency Services and the California Geological Survey and the Emergency Managers in the California coastal counties. These calls help to facilitate information flow and provide support to those regions that need it.
Following the tsunami, the California Geological Survey activated their Tsunami Event Response Program to visit California’s coastal communities impacted by the tsunami. Their team dispatched to talk with county partners, harbor masters and harbor patrol teams, and residents in coastal communities to gather observations and details about the impact of the tsunami. Learn more about the state’s response to the tsunami at tsunami.ca.gov/tonga.